On 5/7/2013, Stanley Druckenmiller and Geoff Canada gave a presentation at Bowdoin College titled: Generational Theft. You can watch the entire thing here. These are my notes. Additional thoughts/takeaways at the end.
- Entitlements:
- Websters: A right you have under the Law
- Actual: A benefit that people have under the Law that they don’t have to provide a current service for
- Income Supplement (lots of Press, but not really anything)
- Unemployment insurance claims
- Food stamps
- Three Main Buckets (big big money) – Primarily for the Elderly
- Medicaid: Income based (70% goes to elderly)
- Social Security
- Medicare
- Income Supplement (lots of Press, but not really anything)
- Druckenmiller started worrying about entitlements in 1994
- In 2011, the baby boomers, the front end of what was going to turn 65, and there would be a huge surge in entitlement payments
- Whats the demographic issue?

- Chart 1: Federal Government Entitlement Transfers as a Percentage of Federal Budget Outlays
- NATION OF TAKERS
- Services/Benefits people get while not providing a current service
- 1960: 28% of Federal Outlays
- 2010: 68% of Federal Outlays
- Used to be 1/3 of Defense, now much more
- Biggest increase took place in Nixon, Ford, GWB admins (NOT a partisan increase)
- Elderly taking a bigger and bigger share even BEFORE baby boomers reach that age

- Chart 2: Benefit per oldster/GDP per capita
- THE LEVEL OF GENEROSITY TO THE ELDERLY HAS ALMOST DOUBLED IN THE LAST 40 YEARS, UNSUSTAINABLE
- Benefit/Oldster has grown MUCH quicker than GDP per capita since the 70s
- 1970: 41%
- 2010: 72%
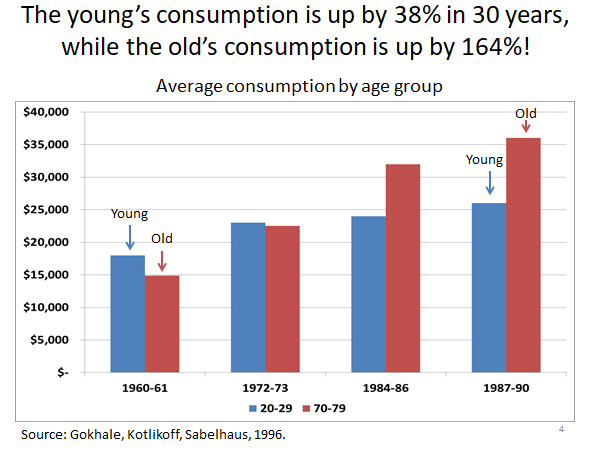
- Chart 3: Average Consumption by Age Group
- YOUNG’S CONSUMPTION IS UP 38% IN 30 YEARS, WHILE THE OLDS CONSUMPTION IS UP 164%
- People receiving outlays are about to explode
- 1960s: 20s consumed much more than people in their 70s
- 1990s: 70s consumer much much more than people in the 90s
- AARP taking money from you and giving to the elderly
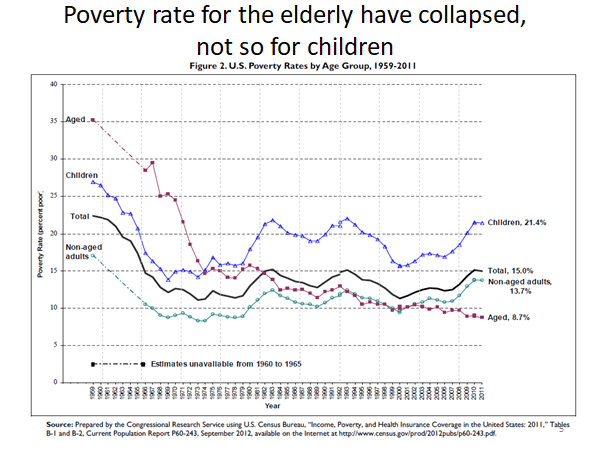
- Chart 4: US Poverty Rates by Age Group
- POVERTY RATE FOR THE ELDERLY HAVE COLLAPSED, NOT SO FOR CHILDREN
- Elderly: 35% -> 9%
- Children: 25% -> 21%
- Minority Children: 31% -> 35%
- Massive wealth transfer from young to elderly

- Chart 5: Average Children per woman
- FERTILITY RATES HAVE GONE DOWN DRAMATICALLY
- Fertility Rates:
- 1950s: 3.7
- 2011: 2.06
- In 1957, there were 100MM less people in the US, and they were having more babies than we are today
- Those babies are about to become seniors, who have been taking more and more, and there are a lot of these babies about to become seniors
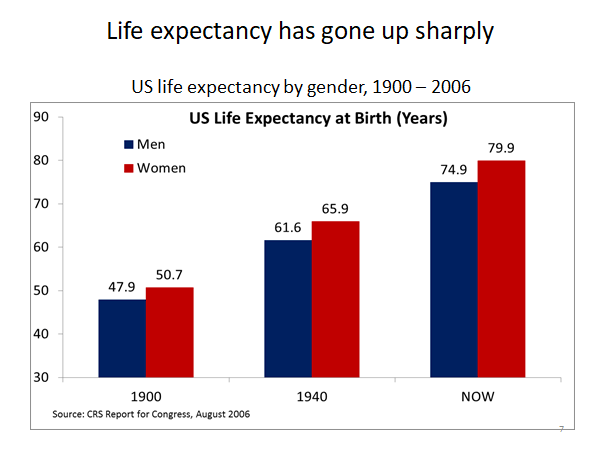
- Chart 6: US Life Expectancy at Birth (Years)
- US LIFE EXPECTANCY HAS GONE UP SHARPLY
- 1900 to Now
- Men: 47.9 -> 74.9
- Women: 50.7 -> 79.9
- Not only will there be MORE oldsters, they will be around for a much longer period of time
- Seniors:
- A) Bigger Share
- B) More of them
- C) Taking for a longer period of time
- Seniors:

- Chart 7: Federal Spending by Entitlement’s Program (% of GDP)
- THE ENTITLEMENTS PROBLEM IS JUST BEGINNING
- Percentage of GDP
- 3 Buckets: MMSS
- Now to 2050: 10% to >20%
- 3 Buckets: MMSS
- Historically, tax revenues as % of GDP have a ceiling around 20%
- Entire tax revenues will be going to people who don’t even provide a service
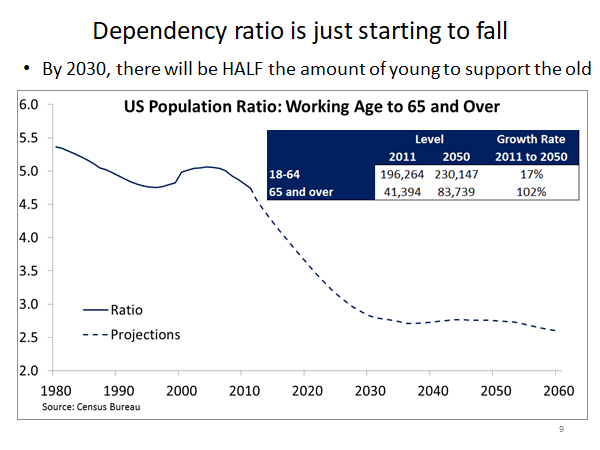
- Chart 8: US Population Ratio: Working Age to 65 and Over
- DEPENDENCY RATIO IS JUST STARTING TO FALL
- By 2030, there will be HALF the amount of young to support the old
- Working age: 18-64: Grow 17% from 2010-2050
- Elders: 65+: Grow 102% from 2010-2050
- 4.8 workers supporting elders
- 2030: 2.9
- 2050: 2.4
- Huge recipient pool, less people giving money to

- US Centenarians (Thousands) are the fastest growing age population
- Oldsters growing at 102%
- 85+ growing at 343%
- 100+ growing at >1000%
- Spend A LOT more on medicare than people in 60s and 70s
- Oldsters growing at 102%

- Chart 9: The True “Fiscal Gap”
- IF TAXES RATES AND THE LEVEL OF GENEROSITY IN ENTITLEMENTS PROGRAMS REMAIN THE SAME, WE HAVE A MASSIVE PROBLEM AHEAD. EITHER TAX RATES RISE OR GENEROSITY FALLS. THERE IS NO ALTERNATIVE
- Total Debt (On the Books): 11Trillion
- Fiscal Gap: 211Trillion
- Expected tax revenues – present value of benefits promised
- Labor: Pay a payroll tax: supposedly to pay social security and future medicare: but it doesn’t pay for you, it pays for the current elders
- All you have is a promise you’ll have some
- Deficit: 10% of GDP, actually 15% of GDP

- Chart 10: Federal Taxes/Expenditures
- THE COST OF WAITING IS ENORMOUS
- The increase in federal taxes and expenditures needed to cover fiscal gap today is much lower than in 40 years
- Increase in all federal taxes:
- Today: 64%
- 20 years: 77%
- 40 years: 93%
- Decrease in all federal expenditures (defense, entitlements, etc)
- Today: 40%
- 20 years: 46%
- 40 years: 53%
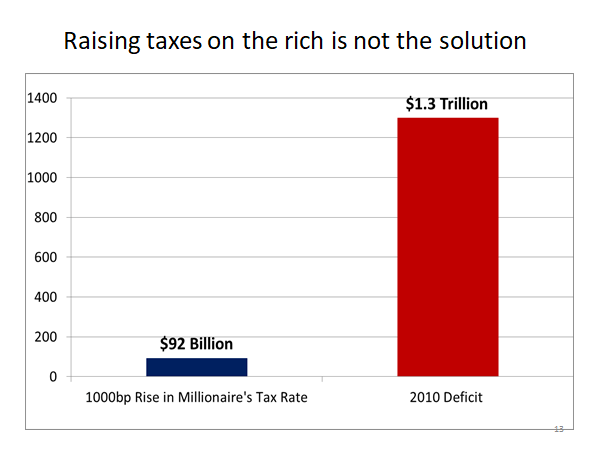
- Chart 11: Raising taxes on the rich is not the solution
- 10%, 1000bp Rise is Millionaire Tax Rate: $92B
- 2010 Deficit: 1.3Trillion (not including off balance sheet)
- At 50%, every day you work until June 30th, all your income goes to someone else
- You don’t get anything till July 1st
- If you tax the rich, they:
- Stop working
- Move
- Even if you get the money, it doesn’t move the needle

- Chart 12: 2011 US Defense spending exceeded the 13 next highest defense budgets combined
- USA: 711B
- China: 130B
- Entitlements growing MORE than 711B, so if you cut 100%, still screwed

- Chart 13: Net worth by age of household head in 2007
- LOWER CAPITAL GAINS AND DIVIDENDS IS A DIRECT TRANSFER FROM YOUNG TO OLD
- 20-34: 100K
- 65-74: 1MM

- Chart 14: US Consumption by age (ratio to labor income ages 30-49)
- THE BIASED GROWTH OF THE WELFARE STATE
- 1960:
- X-axis: Age
- Y-axis: What the average 30-49yr old makes in
- 90yr old is spending 138% what 40 year olds makes
- Spending 2x what 30 year olds spend
- Lots to keep elders alive an extra 5 days
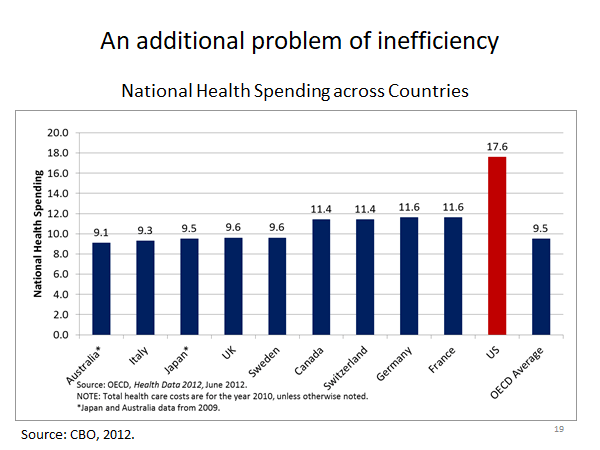
- Chart 15: National Health Spending across countries
- AN ADDITIONAL PROBLEM OF INEFFICIENCY. US not even close to any other country
- US: 17.6
- Average: 9.5

- Chart 16: Despite spending 2x average country, health outcomes are bad
- Spending the most, yet near the bottom for health outcomes
- Why? Screwed up system: Malpractice insurance scam of an industry
- Lawyers taking a bigger bite from physician income – NOT the biggest problems
- Incentivizes hospitals to run insane (10-15 tests) that studies have shown don’t actually make an impact on end result
- CYA policy (cover your ass)
- Medical bills all done through insurance – people have no idea what they pay
- HAVE TO force people to shop (aka know the prices), otherwise things won’t improve
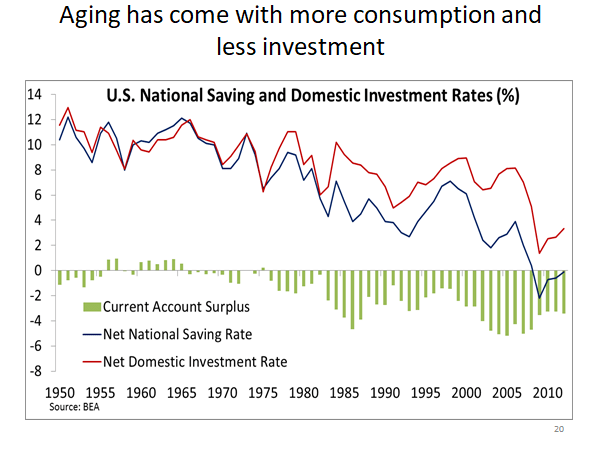
- Chart 17: US National Saving and Domestic Investment Rates (%)
- AGING HAS COME WITH MORE CONSUMPTION AND LESS INVESTMENT
Some Additional Thoughts:
- As of this post, it has been 6 years since Druckenmiller went on his college campus tour. Unfortunately, it appears that he was unable to inspire the youth to go out and fight for their future.
- Interestingly, the Medicare and Medicaid have been core issues that politicians have been campaigning around. However, there has yet to be a convincing payment proposal. The wealth tax in particular has been a central focus for the Democratic Party in the run-up to the 2020 election.
- It is increasingly clear that the ElderTech market will be far bigger than anyone imagined. However, there has yet to be a majorly-funded ElderTech startup, nor the establishment of any ElderTech venture capital funds/teams.
- Historically, America has hidden (or solved, depending on who you ask) its demographic issues by taking in immigrants. However, since the 2016 US Presidential Election, relying on immigrants is becoming less and less likely, whether that be for blue collar jobs or white collar jobs.
- America’s demographics seem to be following in the footsteps of Japan, Korea, the Scandinavian countries, and many other countries: less babies, less immigration. Will this lead to a stagnating US economy?
- Given the increasing Elder population and shrinking Youth population, it is more important now than ever to invest in our children. Currently seeking out children/education-focused startups.
- Note: Thought of the Malthusian Trap and a running out of resources. Similar to the industrial revolution, the implementation of AI will likely increase human productivity by leaps and bounds. But will it be enough?
